Agent Sandbox Wakeup: What to Prefetch Matters More Than When
A tool call is visible in the token stream 1.7 seconds early, but the restore cost is which pages come back and how they are laid out on swap. In interactive sessions, reclaiming only the long gaps where a person is waiting already captures nine tenths of the memory benefit.
Coding agents, data-analysis agents, and agentic RL rollouts each give a session its own sandbox: an isolated environment that holds an interpreter, dependencies, a dataset, and browser processes. The sandbox spends most of its time waiting for the model, and the model spends most of its time waiting for a tool inside the sandbox to finish. When hundreds or thousands of sessions run together, the resident memory of idle sandboxes becomes the scarce resource, and swapping them out means the next tool call pays to wake them up. This article looks at a solution that looks clean. Before a tool call is fully generated, its name and arguments are already in the inference stream, so the sandbox can be restored during that lead time. We measured this on real sessions and real sandboxes. The lead time is real. It is almost never the quantity that decides the cost. What remains is an arithmetic condition for whether reactivation can be hidden, and three measured facts about how agent sandboxes use memory.
Why the sandbox waits, and why it is expensive
An agent session moves in rounds. The model reads context, writes a stretch of reasoning, and emits a tool call. The sandbox runs the tool and returns the result. The model starts the next round. Across 204 real coding-agent sessions, tool execution has a median of 0.16 seconds and a p90 of 7.1 seconds, while a model-inference stretch averages on the order of ten seconds. The idle gap between two tool calls splits at 600 seconds into two kinds. The short kind is waiting inside the tool loop, median 4.8 seconds. The long kind is waiting for a person to come back, or a paused session. That geometry is the space available for reclaim: a sandbox is idle almost all of the time.
The memory is not small. A data-science sandbox with pandas and a dataset resident holds several gigabytes of anonymous pages. A Chromium sandbox doing browser automation holds a bit over two gigabytes across nine processes. One characterization of agent systems, so far only on arXiv, reports a per-session sandbox working-set peak of 28 GB (AgentSysBench, arXiv 2608.15127). We did not reproduce that number. It is only a scale reference. Agentic RL makes the problem sharper. A group of rollouts is often 8 to 16 trajectories, each with a sandbox, and RollArt reports that environment-reset latency in production can reach hundreds of seconds in the tail (Gao et al. 2026, OSDI). Long-lived sandboxes also hold hot runtime state such as compiler daemons and language servers. Whether that state can be invalidated selectively is a separate question. This article is only about the memory pages.
Reclaim and restore: three existing lines
The first line swaps cold memory out transparently. Linux cgroup v2 offers memory.reclaim. Writing a byte count makes the kernel reclaim that much memory from the control group (Linux cgroup v2 documentation). The anonymous pages can go to two places. zram is a compressed in-memory block device. Pages stay in memory after compression, and swap-in is decompression (Linux zram documentation). A block-device swap writes pages to disk. Capacity is saved, and swap-in is slow. Google’s software-defined far memory uses zswap to compress cold pages proactively, holding about 20% of the cold data on average at an access cost of about 6 microseconds (Lagar-Cavilla et al. 2019, ASPLOS). Meta’s TMO uses pressure stall information, PSI, to measure the work lost to resource shortage and decides how much to offload from that, reclaiming every 6 seconds without application cooperation (Weiner et al. 2022, ASPLOS). This line solves capacity. Fetching a page back is a fault, which means restore starts after the access.
The second line prefetches from a recorded working set when the call arrives. When a serverless function restores from a snapshot, page faults dominate function time. REAP’s original number is 95%. Its method records the working set on the first call and prefetches that record on every later arrival. It depends on the working set being stable across calls. Seven of ten functions share more than 97% of their pages, the worst still shares 76%, and cold start drops by 3.7 times on average (Ustiugov et al. 2021, ASPLOS). FaaSnap points out that the working set moves sharply with the input, and REAP then gets worse. Concurrent faults let the guest start executing immediately, up to 3.5 times faster than REAP (Ao et al. 2022, EuroSys). Spice lays the snapshot out on disk in the predicted access order, so a restore from disk is only 0.6 to 18 milliseconds slower than a warm call (Holmes et al. 2026, OSDI). The usual base is a light microVM such as Firecracker, with under 5 MB of memory overhead per container (Agache et al. 2020, NSDI). This line makes restore fast, but the trigger is still call arrival, and the working sets are megabytes.
The third line starts before the call arrives. Serverless in the Wild records each function’s inter-arrival histogram and warms the function just before the next call (Shahrad et al. 2020, ATC). Orion uses the DAG structure plus a latency model to estimate when a downstream function will arrive, and warms the VM just before that (Mahgoub et al. 2022, OSDI). What they start early is a new instance. The signal is a statistic or a static structure, not an explicit announcement of one particular call before it happens. On the far-memory side, Leap prefetches by majority vote over trends in the access history (Al Maruf and Chowdhury 2020, ATC). That signal is history as well.
TL;DR
A tool call is visible in the inference stream before it has been fully generated. The natural guess is to restore the reclaimed sandbox during that lead, so wakeup leaves the critical path and idle sandboxes can sit near zero.
The lead is real. On 204 coding-agent sessions, and inside one KVM guest, we timed more than ten restore methods on a pandas sandbox, a Chromium sandbox, and a Vite sandbox, over zram and over a SATA disk. From the tool name until the call can be dispatched, the median is 1.71 seconds. It is not what dominates. On a 6.3 GB pandas sandbox on SATA, prefetching the previous call’s working set adds 6.1 seconds. Starting 1.7 seconds early only brings that to 4.7 seconds. Knowing exactly which pages this call will touch, even if the prefetch starts at arrival, brings it to 1.4 seconds, and the lead then brings it to 0.35 seconds.
Adjacent calls barely share pages. On pandas the overlap is 0.054. Restore cost follows how the pages sit on swap, not how many bytes they are. A call that touches the whole table takes 17 to 98 seconds under every method. In interactive sessions, 90.4% of idle memory-seconds sit in human waits longer than 600 seconds. Reclaim only there, and restore the whole sandbox when the request is issued. That already takes nine tenths of the memory benefit, at under 1.7% of active time. A new early signal has to be compared with the earliest signal the system already has. A restore stays hidden only when touched bytes fit inside the lead time times the effective bandwidth, and that bandwidth is set by the swap layout.
The signal that appears inside the inference stream
The serving side of LLMs is already using the fact that output is visible before it is finished. Anthropic’s streaming protocol emits the tool name when a tool-call block starts, and the arguments then stream out in pieces (Anthropic streaming documentation). LLMCompiler’s streaming planner starts executing tool calls that have already been parsed before the plan is finished (Kim et al. 2024, ICML). Pie splits the generation loop into fine-grained handlers given to the user program, so arbitrary computation and I/O can be inserted into the stream (Gim et al. 2025, SOSP). InferCept decides whether KV stays or goes while a tool call is in flight, but the restore happens after the tool returns (Abhyankar et al. 2024, ICML).
Put the two sides together and a position appears that nobody seems to occupy. A reclaimer has only been able to guess the next access from history. The inference stream announces that access several seconds before it happens. No layer hands that announcement to the memory manager.
An intuition: announce early, and the restore can hide
The intuition is a claim about the system. The start of reactivation can move from the moment of access to the moment the access is announced. The instant a tool name appears in the token stream, restore of that sandbox’s memory begins. By the time the arguments have streamed out and the call is actually dispatched, the pages are back in memory, and sandbox wakeup is no longer on the critical path. The reclaimer can then push the sandbox close to zero in every idle gap, without worrying about wakeup latency.
It looks plausible because three scales seem to line up. The lead time is seconds, because arguments stream out one token at a time. Reactivation is also seconds, because a working set of gigabytes comes back from disk or from compressed memory at a few gigabytes per second. A REAP-style prefetch that starts only when the call arrives depends on a stable working set. Each agent tool call has a different command and different files, so whether the working set is stable is exactly the unknown. An earlier trigger by itself is not enough. That is only a scheduling policy. For the claim to hold, two things have to be true at once. Reactivation is on the order of seconds and an arrival-time prefetch cannot absorb it, and the lead time is long enough and the working set can be predicted from the contents of the call.
Four falsification lines and the measurement setup
Four falsification lines were fixed before any measurement. The extra latency of an arrival-time prefetch has a median under 0.3 seconds, which would mean the strongest existing combination is already enough. Hiding all of that arrival-time extra latency saves less than 10% of per-step session time even on the most favorable sandbox. The lead-time median is under 0.5 seconds. The overlap of touch sets between adjacent calls is above 0.8, which would mean the working set is stable and REAP already covers it. If any one of these holds, the claim does not.
The lead time has two sources. The first is logs from 204 real coding-agent sessions from Claude Code, including sub-agents, with 13409 tool-call blocks. The log writes a line when each content block ends, so the start of a block is approximated by the timestamp of the previous content line in the same request, and the end of the block is the dispatch time. The lead time is the difference. This is a block-level approximation, not a token-level timestamp. The first block has no predecessor and is excluded, leaving 9599 blocks. The second source serves Qwen3.6-35B-A3B with vLLM 0.25.1 at tensor-parallel degree 2 on two A40s, and measures directly, at concurrency 1, 16, and 64, the time from when the tool name is visible on the streaming interface until the call completes.
Reactivation is measured inside one KVM guest: Linux 6.8, 16 vCPUs, 24 GiB of memory. Swap has two tiers. One is 20 GB of lz4 zram. The other is a 16 GB virtio disk on the host’s SATA SSD. After that disk is full, 4K random reads are about 23 MB/s at queue depth 1, about 354 MB/s at queue depth 32, and sequential reads are 536 MB/s. The three sandboxes are deliberately different materials. The pandas data-science sandbox is resident at 6.3 GB, almost all anonymous pages, and the data is a random floating-point dataframe. The Chromium browser-automation sandbox is 2.2 GB, 84% anonymous, spread across nine processes. The Vite plus TypeScript frontend-build sandbox is only 0.16 GB, mostly file pages. Each sandbox runs a real tool sequence of about ten calls. Before each call, memory.reclaim pushes the sandbox under 8 MiB. pagemap and mincore record the pages that call actually touches. Prefetch is issued by a helper process inside the sandbox’s control group, using process_madvise with MADV_WILLNEED and posix_fadvise (process_madvise manual).
The restore methods are laid out along signal and content. Demand paging. Prefetch of the previous call’s record at arrival, the REAP style. The same record started 1.7 seconds early. The exact touch set started at arrival. The exact touch set started 1.7 seconds early. And a full prefetch of the whole sandbox when the request is issued, 6.8 seconds early. The exact touch set is known only after the fact, so it is an upper bound on the dimension of knowing the content. Extra latency for every method is computed against the same call with the sandbox left resident and not reclaimed. Each method runs the call sequence once per sandbox. The resident baseline differs by up to a factor of two between the two passes, so differences under 0.5 seconds are inside the noise and cannot be ranked. As a comparison, CRIU does a process-level checkpoint, both a full restore and a lazy-pages restore. The latter is served on fault by a daemon through userfaultfd (CRIU lazy migration).
Evidence: the lead time is real, and it is not the dominant term
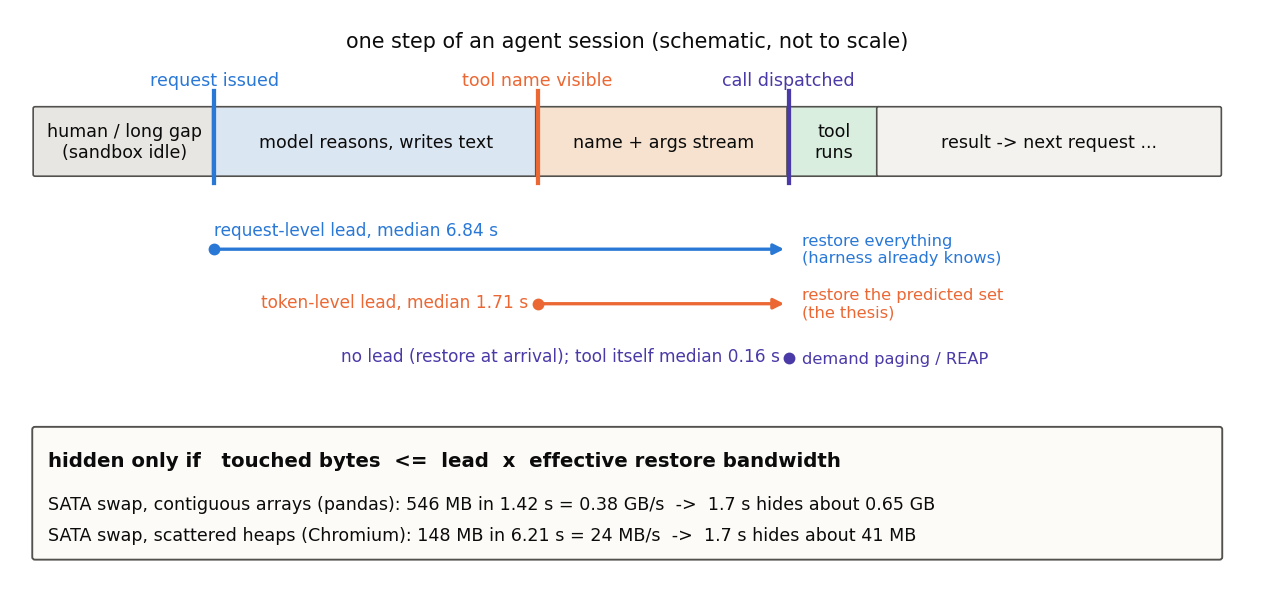
Figure 1 is the reading path for the rest of the article. The top row is one agent step, from the request issued after a long gap, through the model’s reasoning text, through the tool name and arguments streaming out, to dispatch and execution. The three arrows are the three moments a restore can start: when the request is issued, which the agent’s execution framework already knows; when the tool name is visible, which is the claim above; and when the call is dispatched, which is demand paging and REAP. The box below is the condition every later number has to obey. Touched bytes must not exceed lead time times effective restore bandwidth, or the restore cannot be fully hidden. The two effective bandwidths in the box are read from the measurements. The pandas arrays are contiguous on swap: 546 MB comes back in 1.42 seconds, about 0.38 GB/s. Chromium’s heap pages are scattered: 148 MB takes 6.21 seconds, about 24 MB/s, close to the SATA disk’s 4K random-read speed at queue depth 1. The same 1.7 seconds of lead time hides about 0.65 GB in the first case and about 40 MB in the second.
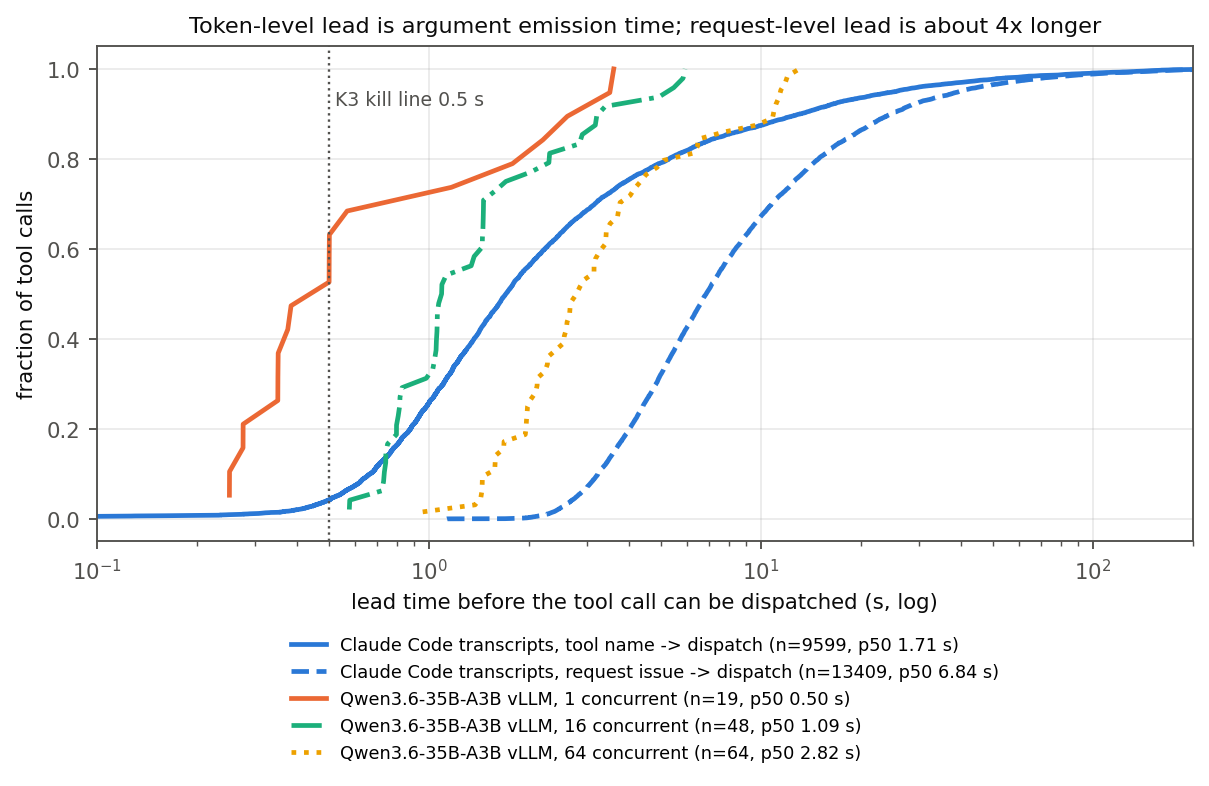
Figure 2’s horizontal axis is the lead time before a call can be dispatched, on a log scale, and the vertical axis is the cumulative fraction. The solid line is real sessions, from the tool name appearing until dispatch: median 1.71 seconds, p90 13.2 seconds, and only 4.2% below the 0.5-second falsification line, so that line does not fire. Its length is set by argument length, about 170 bytes per second. A token-level lead time is essentially the time it takes the arguments to stream out. The dashed line is from request issue until dispatch, median 6.84 seconds, four times the token-level lead. Of the requests issued immediately after a tool result, 93.0% end in a tool call. At the moment the request is issued, the execution framework already knows, with better than nine-tenths confidence, that the sandbox is about to be used. The three local-model lines show that lead time moves with load: 0.50 seconds at one stream, 1.09 seconds at 16, and 2.82 seconds at 64. The busier the inference, the longer the lead.
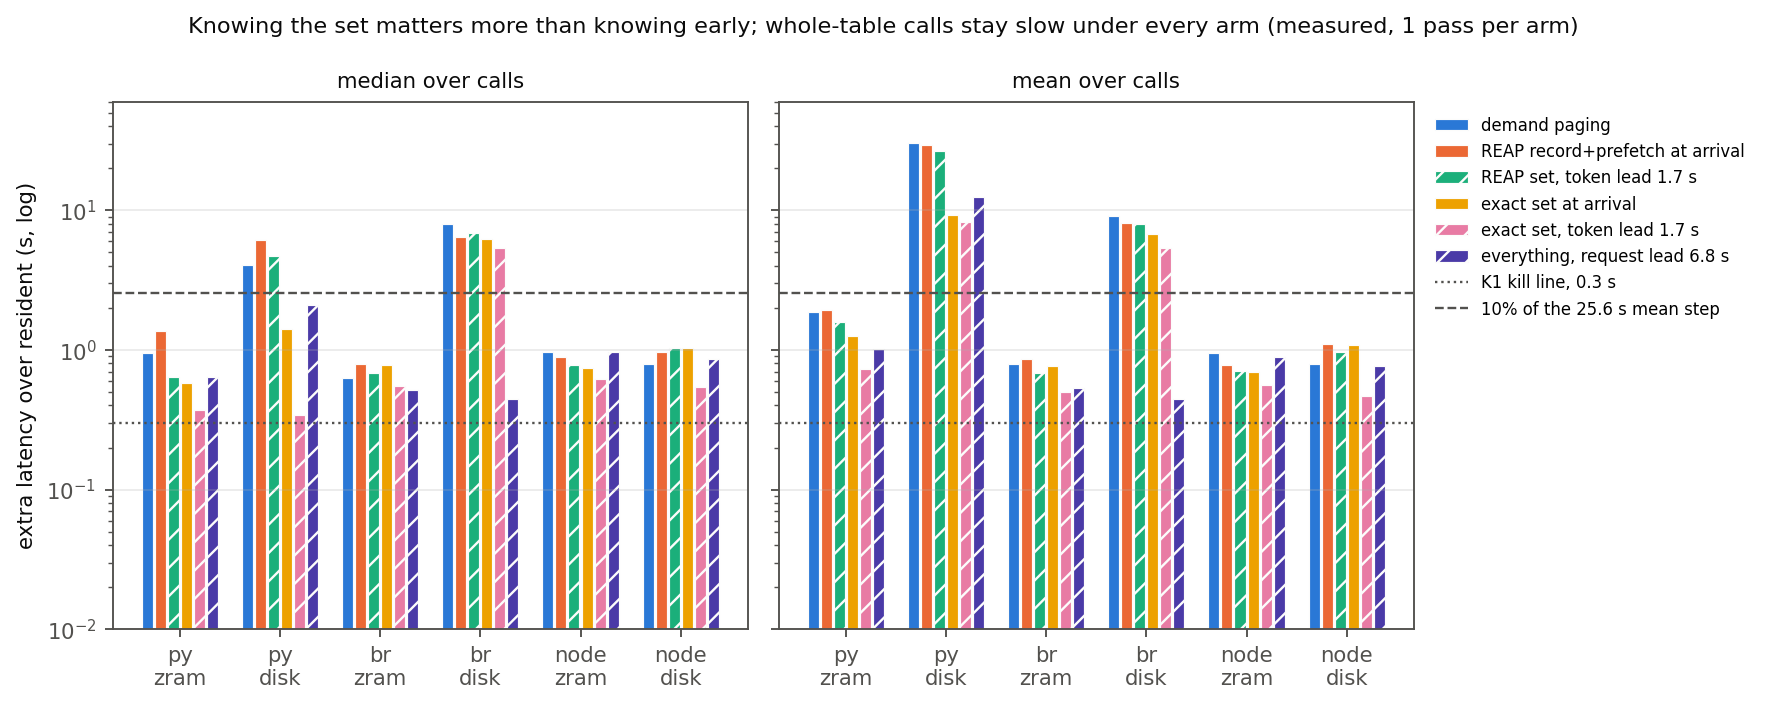
Figure 3 is the decisive data. The horizontal axis is the six combinations of sandbox and tier. Each group has six bars, one per restore method. The vertical axis is extra latency against the resident baseline, on a log scale. Start with the most favorable group, the pandas sandbox on SATA. Demand paging adds a median of 4.04 seconds. Prefetching the set recorded from the previous call is worse: 6.11 seconds when started at arrival, and still 4.73 seconds when started 1.7 seconds early. The exact touch set, started at arrival, drops to 1.42 seconds, and adding the 1.7-second lead brings it to 0.35 seconds. Said another way, switching from history to exact content saves about 4.7 seconds. Adding the lead time on top of exact content saves only about one more second. That is where the title comes from. An arrival-time prefetch of 6.11 seconds is not under 0.3 seconds. Against a per-step average session time of 25.6 seconds, hiding it is 23.8%, above 10%. The first two falsification lines also do not fire.
Recorded prefetch is worse than demand paging because the touch sets of adjacent calls barely overlap. The median overlap is 0.054 on pandas, 0.22 to 0.26 on Chromium, and only the Vite build sandbox reaches 0.75. REAP measured 76% to 97% on serverless functions. In a data sandbox an agent reads different columns and different slices on each call. Most of the previous record is a wasted read, and that wasted read occupies disk bandwidth. The fourth falsification line, overlap above 0.8, also does not fire, and the data moves away from it.
The means on the right panel are a different fact. On pandas over disk, every method has a mean between 8 and 30 seconds, far above the median, pulled up by a few calls. Boolean filters, sorts, query, and sampling materialize the whole table, really touching 5.1 GB, and on SATA that takes 17 to 98 seconds no matter the method. Chromium on disk has a point that runs against intuition. Prefetching the exact 148 MB this call touches takes 6.2 seconds at arrival and still 5.4 seconds with a 1.7-second lead, while reading the whole 1.8 GB back sequentially when the request is issued adds only 0.45 seconds. Reading ten times the bytes is more than ten times faster. Restore cost is not paid per byte. It is paid by how scattered the swapped-out pages are. On zram every method stays within about one second, but random floating-point data compresses only to 1.23 times and saves only about 19% of memory. Chromium’s JavaScript heap compresses 3 to 13 times. That was measured on a synthetic page, and it is optimistic.
A few comparisons fill in the space outside the figure. A full CRIU restore of a 6.4 GB image has a median of 15.8 seconds. A lazy-pages restore itself takes only 0.55 seconds, but later calls slow down: eight calls average an extra 9.6 seconds, and one full-table sample under lazy-pages did not finish in more than 12 minutes, with the daemon pinned on one core. One reclaim plus a full swap-in drops transparent huge pages from 5990 MB to 22 MB, but the calls do not get slower. process_madvise with MADV_WILLNEED only reads pages into the swap cache. It does not build page tables. After a full prefetch, about 1.1 GB still takes a minor fault, a floor of 0.3 to 0.6 seconds.
Last is whether the content can be predicted before the call arrives. We wrote a rule that looks only at the call text. Column names that appear in the call imply which columns will be read, and those columns map to address ranges. The rule and 6 held-out calls were frozen before any held-out call ran. On 14 calls that do not materialize the whole table and whose touch set is nonempty, recall is 0.92 to 0.995 and precision is 1.0. Restoring from that prediction 1.7 seconds early has a median extra latency of 0.77 seconds on the original calls and 0.73 seconds on the held-out calls, against 4.2 to 4.3 seconds for demand paging. The 3 full-table calls have recall of only 0.09 to 0.19, so the mean returns to 25.6 seconds, almost level with demand paging at 29.2 seconds. If prefetch is issued column by column in the real streaming order of the arguments, the median is 1.1 to 1.4 seconds. Half of the timing is eaten by the arguments streaming out. The column name is itself inside the arguments. The later it appears, the less time is left for restore.
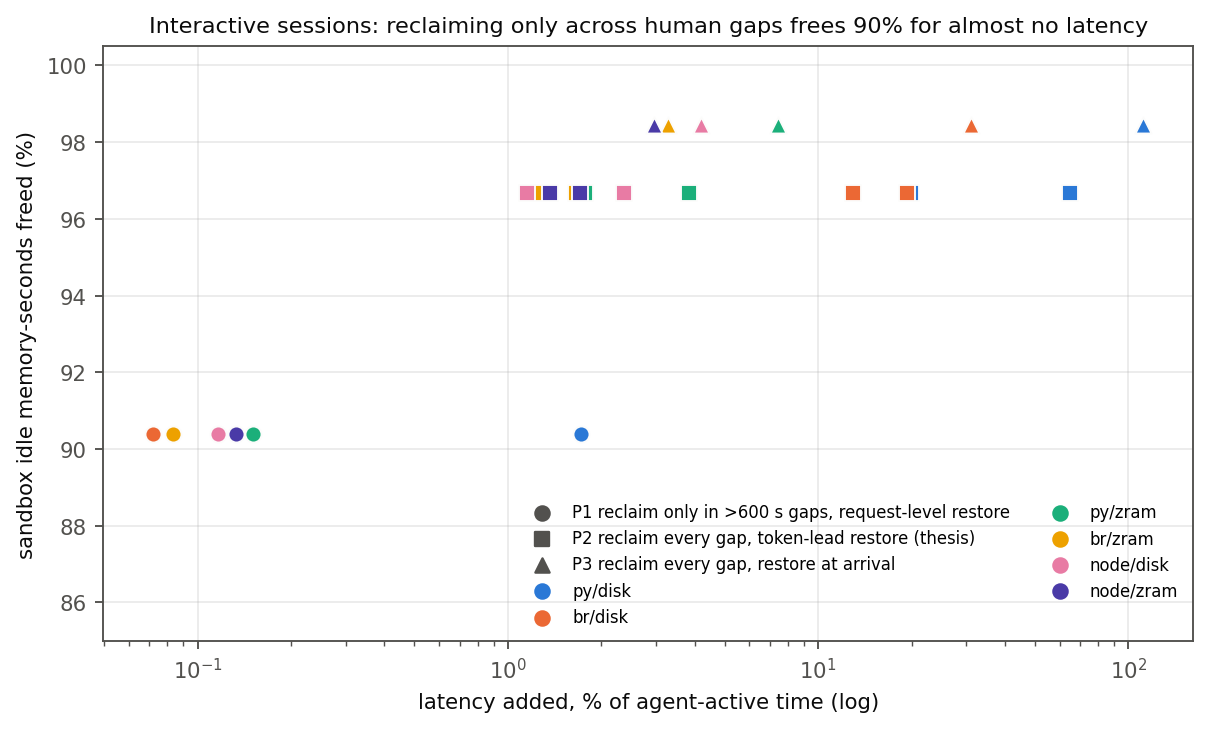
Figure 4 puts the measured restore cost back into the idle geometry of the real sessions. It is a desk calculation. Reclaim itself is charged at 2 seconds, which is optimistic for reclaim inside the tool loop. The horizontal axis is added delay as a fraction of the agent’s active time, on a log scale. The vertical axis is the fraction of sandbox idle memory-seconds that are freed. The circle reclaims only human-wait gaps longer than 600 seconds and restores the whole sandbox when the request is issued: 90.4% freed, 426 reactivations, and the delay on the worst case, pandas on disk, is 1.7% of active time, under 0.2% on the other sandboxes. The square is the policy that matches the claim above, reclaiming every gap and restoring with the 1.7-second token-level lead: 96.7% freed, 7442 reactivations, and on pandas over disk the delay is 20.0% with the exact set and 64.6% with the historical record. The triangle reclaims every gap and restores at arrival: 98.5% freed, with delay up to 111.7%. The 90.4% is the idle geometry itself. Across the 204 sessions, the short gaps inside the tool loop are only 9.6% of idle memory-seconds. Any reclaim scheme that acts only inside the tool loop has a memory-benefit ceiling of those 9.6 points.
Timing loses to content, and to an earlier signal
None of the four falsification lines that were fixed in advance fired. The claim is not stopped by one of them. The evidence forces a different statement of it, and that statement fails too.
Timing is not the dominant term. On the same sandbox and the same disk, switching from a historical record to exact content saves about 4.7 seconds. Adding a 1.7-second lead on top of exact content saves only about one more second. Without exact content, the lead time is almost useless. The claim treated timing as the valuable part. The measurements say the valuable part is which pages come back.
The token-level signal sits under a signal the system already has. When the request is issued, the execution framework already knows the sandbox is about to be used. That signal leads by a median of 6.84 seconds, four times the token-level lead, and 93% of those requests do end in a tool call. In interactive sessions, that request-level signal plus reclaim only during human-wait gaps already captures 90.4% of the memory benefit. The token-level scheme picks up only 6.3 more points and pays one or two orders of magnitude more delay.
Rewriting the claim as “predict the touch set from the call arguments” is still not enough. In an autonomous loop with no human-wait gap, for example an RL rollout, the request-level signal loses its advantage, and reclaim inside the loop is the only source of benefit. From the idle geometry, the ideal density ceiling of in-loop reclaim is about 1.76 times. That is the space this direction still has, and restoring from the arguments is the path that tries to take it. It holds only on calls that do not materialize the whole table. The full-table calls are exactly the ones that dominate the mean, and on SATA no lead time hides them. On zram the latency cost is only 1.8% to 3.8%, but numeric data saves only 19% of memory, a density of about 1.09 times. Wiring arguments to restore needs only a predictor. The mechanism itself can be assembled from a streaming interface, an Orion-style start before arrival, a REAP-style prefetch, and Linux’s reclaim interface. Take off the wrapper and what remains is a few new measurements, not a new mechanism. Work in the same direction, so far only on arXiv, warms a sandbox early from keywords and streaming embeddings in the token stream (SpecBox, arXiv 2607.23933). The trigger itself is not scarce.
A few gaps remain. The test machine has only a SATA disk. NVMe is about ten times faster, and a CXL pool is faster still, so the hiding boundary would move from 0.65 GB to several gigabytes and a full-table call might become hideable. That favors the claim, and it was not measured. All three sandboxes are constructed. The 6 GB pandas sandbox was chosen because it is the favorable case, and a real deployment’s sizes are unknown. Every sandbox number comes from a KVM guest, so faults include EPT overhead and restore looks more expensive than on bare metal. Each method ran the sequence once, so differences under 0.5 seconds cannot be ranked. Session lead times are timestamps of content blocks, not of tokens. Chromium’s compression ratio comes from a synthetic page. Sandboxes with a GPU were not measured.
Five measurements of agent sandbox memory
In real coding-agent sessions, the lead from when a tool name is visible until the call can be dispatched has a median of 1.71 seconds. Length follows the arguments, about 170 bytes per second. The lead from when the request is issued until dispatch has a median of 6.84 seconds, and 93% of those requests end in a tool call. A new early signal has to be compared with the earliest signal the system already has, not with having no signal at all. What it adds is precision and content. This was measured on 204 Claude Code sessions, at block-level approximation. The busier the inference, the longer the token-level lead. A local 35B mixture-of-experts model rises from 0.50 seconds at one stream to 2.82 seconds at 64.
The working set of an agent data sandbox does not come back on the next call. Overlap of touch sets between adjacent calls has a median of 0.054 on pandas and 0.22 to 0.26 on Chromium. Only the frontend-build sandbox reaches 0.75. Serverless functions sit at 76% to 97%. Recording the last call and prefetching it can therefore be worse than demand paging. On pandas over SATA the median extra latency is 6.1 seconds for the record and 4.0 seconds for demand paging. That is three constructed sandboxes, each with about ten calls. A sandbox dominated by file pages, such as a frontend build, is the exception.
Reactivation can be hidden when touched bytes do not exceed lead time times effective restore bandwidth. That bandwidth is set by the storage tier and by how the swapped-out pages are laid out, not by the device’s nominal bandwidth. On a SATA SSD, a contiguous array is about 0.38 GB/s. A browser heap scattered across nine processes is about 24 MB/s. The same 1.7 seconds hides 16 times more bytes in the first case. An exact prefetch of 148 MB on the Chromium sandbox takes 6.2 seconds, while a sequential read of the whole 1.8 GB adds only 0.45 seconds. A cost model that writes bytes divided by bandwidth underestimates by 3 to 16 times here.
In interactive agent sessions, 90.4% of sandbox idle memory-seconds sit in human-wait gaps longer than 600 seconds. The short gaps inside the tool loop are 9.6%. Reclaiming only the long gaps, and restoring the whole sandbox when the request is issued, captures nine tenths of the benefit. Even on the worst sandbox the delay is under 1.7% of active time. Any reclaim scheme that acts only inside the tool loop tops out at those 9.6 points. This depends on how often a person comes back in these sessions, and on charging reclaim at 2 seconds. It does not hold in an autonomous loop with no person in it. There, reclaim inside the loop is the only source of benefit.
At column granularity, the pages one call touches in a data sandbox can be predicted from the call text, with recall above 0.92 and precision 1.0. That holds only for calls that do not materialize the whole table. Boolean filters, sorts, query, and sampling touch the whole table, and recall falls below 0.2. On SATA every restore method then takes 17 to 98 seconds. The calls that can be predicted were cheap anyway. The expensive ones cannot be predicted. This was measured on a 6 GB random floating-point dataframe and on frozen held-out calls. A faster storage tier would shrink the cost of the full-table calls.
The coverage of this article stops here: one KVM guest, SATA and zram, three constructed sandboxes, and one batch of coding-agent sessions. It does not show that a token-level lead time can move sandbox reactivation off the critical path. It does not show that agent sandbox working sets are generally gigabytes. It does not extend to NVMe or CXL. What it does show, under these conditions, is that the cost of waking a sandbox is what has to come back and how it is laid out, not when the fetch starts.
Ninety percent of idle memory is the human wait
In interactive sessions, 90.4% of sandbox idle memory-seconds sit in human-wait gaps longer than 600 seconds. Reclaim only there, and restore the whole sandbox when the request is issued. That already takes nine tenths of the memory benefit, at a delay under 1.7% of active time. A new early signal has to be compared with the earliest signal the system already has. Whether a restore can be hidden depends on how many bytes are touched, how long the lead is, and the effective restore bandwidth. That bandwidth is set by how the pages sit on swap.
Related analysis
Agent Sandbox: What Can Still Cut Runtime Memory and Page Faults looks at the same wakeup from the other side. After reclaim, where the pages sit on swap, and how much of that disk read a placement change can still remove on Linux 6.1 and 6.12.
工具调用在 token 流里提前 1.7 秒可见,但决定恢复代价的是要取回哪些页以及它们在 swap 上怎么排。交互式会话里,只在人等的长间隙回收就拿到了九成内存收益。
coding agent、数据分析 agent 与 agentic RL 的 rollout 都要给每个会话配一个沙箱:一个装着解释器、依赖、数据集、浏览器进程的隔离环境。沙箱大部分时间在等模型推理,模型推理大部分时间又在等沙箱里的工具跑完。当成百上千个会话并发时,闲置沙箱的常驻内存成了约束资源,而把它们换出去又意味着下一次工具调用要付一笔重新激活的代价。这篇文章讨论的是一个看起来很漂亮的解法:工具调用在被完整生成之前,它的名字与参数就已经出现在推理流里,于是可以在这段提前量里把沙箱恢复回来。我们在真实会话与真实沙箱上把这件事量了一遍,发现提前量确实存在,但它几乎不是决定性的量。剩下的是一条判断重新激活能否被藏住的算术条件,以及三条关于 agent 沙箱内存行为的实测事实。
沙箱为什么在等,又为什么贵
一个 agent 会话的节奏是一轮一轮的:模型读上下文、写一段推理、发出一个工具调用,沙箱执行工具、把结果交回,模型再开始下一轮。我们统计的 204 个真实 coding agent 会话里,工具执行时长的中位只有 0.16 秒,p90 是 7.1 秒;而模型推理段平均十几秒。两次工具调用之间的沙箱闲置间隙,按 600 秒切成两类:短的是工具回路内的等待(中位 4.8 秒),长的是等人回来或会话暂停。这个几何决定了回收的空间:沙箱绝大部分时间是闲的。
沙箱的内存又不小。一个装好 pandas 与一份数据集的数据科学沙箱,常驻几个 GB 的匿名页;一个跑 Chromium 做浏览器自动化的沙箱,九个进程加起来两个多 GB。一份只在 arXiv 上的 agent 系统特征化测量报告过每会话沙箱工作集峰值 28 GB(AgentSysBench, arXiv 2608.15127),这个数我们没有复现,只作为量级参照。agentic RL 让这个问题更尖锐:一组 rollout 常常是 8 到 16 条轨迹,每条带一个沙箱,RollArt 报告生产中环境重置的长尾延迟可达数百秒(Gao et al. 2026, OSDI)。长寿命沙箱里还有编译 daemon、语言服务器这类热运行时状态,它们能不能被选择性失效是另一件事。本文只讨论内存页本身。
回收与恢复:已有的三条线
第一条线是把冷内存透明地换出去。Linux 的 cgroup v2 提供了 memory.reclaim 接口,写入一个字节数就让内核从这个控制组里主动回收那么多内存(Linux cgroup v2 文档)。回收下来的匿名页可以放到两种地方:zram 是一个压缩的内存块设备,页被压缩后仍留在内存里,换入只需解压(Linux zram 文档);块设备 swap 则把页写到盘上,容量全省但换入慢。Google 的软件定义远端内存用 zswap 主动压缩冷页,平均存放约 20% 的冷数据,访问约 6 微秒(Lagar-Cavilla et al. 2019, ASPLOS)。Meta 的 TMO 用压力停顿信息 PSI 实时度量资源短缺造成的工作损失,据此决定卸载多少,每 6 秒回收一次,不需要应用配合(Weiner et al. 2022, ASPLOS)。这条线解决了容量,取回靠缺页,也就是访问发生之后才开始恢复。
第二条线是在调用到达时按记录预取。serverless 函数从快照恢复时,缺页处理占了函数处理时间的大头,REAP 的原文数字是 95%。它的解法是第一次调用时记录工作集,之后每次调用到达就按记录主动预取;它依赖的前提是工作集跨调用稳定,10 个函数里 7 个有 97% 以上的页相同,最差的也有 76%,冷启动因此平均降低 3.7 倍(Ustiugov et al. 2021, ASPLOS)。FaaSnap 指出工作集会随输入剧烈变化,此时 REAP 性能下降,它用并发缺页让客户机立即开始执行,比 REAP 快至多 3.5 倍(Ao et al. 2022, EuroSys)。Spice 把快照在盘上按预测的访问顺序布局,从盘恢复只比热调用慢 0.6 到 18 毫秒(Holmes et al. 2026, OSDI)。这些系统的底座通常是 Firecracker 这类轻量 microVM,每个容器内存开销不到 5 MB(Agache et al. 2020, NSDI)。这条线把恢复做快了,但触发点仍然是调用到达,而且工作集都是 MB 级。
第三条线是在调用到达之前动手。Serverless in the Wild 用直方图记录每个函数的调用间隔,恰在下一次调用之前预热(Shahrad et al. 2020, ATC)。Orion 在 serverless DAG 里用 DAG 结构加延迟模型估出下游函数何时到达,恰好在那之前预热 VM(Mahgoub et al. 2022, OSDI)。它们提前的对象是新实例,信号来自统计或静态结构,而不是某一次调用在发生前的显式宣告。远端内存那边,Leap 用访问历史里的多数投票识别趋势来预取(Al Maruf and Chowdhury 2020, ATC),信号同样是历史。
TL;DR
工具调用在推理流里还没写完,名字就已经可见。一个自然的假设是,趁这段提前量把回收掉的沙箱内存取回来,唤醒就离开关键路径,闲置沙箱可以压到接近零。
提前量是真的。204 个 coding agent 会话,加上一台 KVM 客户机里的十余种恢复方式,覆盖 pandas、Chromium 和 Vite 三类沙箱,以及 zram 和 SATA 两档 swap。工具名出现到调用可以派发,中位 1.71 秒。它不是主导量。6.3 GB 的 pandas 沙箱在 SATA 上,按上一次调用的工作集预取,中位多 6.1 秒。提前 1.7 秒开始,也只降到 4.7 秒。若精确知道这次要碰哪些页,即使调用到达才开始,也降到 1.4 秒。再加上提前量,是 0.35 秒。
相邻两次调用几乎不碰同一批页。pandas 的重合度是 0.054。恢复代价由页在 swap 上怎么排决定,不由字节数决定。碰到整张表的调用,任何方式都要 17 到 98 秒。交互式会话里,90.4% 的闲置内存秒数落在超过 600 秒的人等间隙里。只在那里回收,并在请求发出时把沙箱全部恢复,就拿到九成内存收益,延迟不到活跃时间的 1.7%。新的提前信号要拿来和系统已经有的最早信号比。恢复能不能被藏住,取决于碰到多少字节、提前多久,以及有效恢复带宽。带宽由换出之后页怎么排决定。
推理流里多出来的那个信号
LLM 服务这一侧也在把输出未完成就可见这一性质用起来。Anthropic 的流式协议在一个工具调用块开始时就先发出工具名,参数随后一段段流出(Anthropic 流式接口文档)。LLMCompiler 的流式规划器在规划没写完时就开始执行已经解析出的工具调用(Kim et al. 2024, ICML)。Pie 把生成循环拆成细粒度 handler 交给用户程序,允许在生成流中插入任意计算与 I/O(Gim et al. 2025, SOSP)。InferCept 处理工具调用期间 KV 的去留,但恢复发生在工具返回之后(Abhyankar et al. 2024, ICML)。
把这两边放在一起,就出现了一个看起来没人占的位置:回收方一直只能从历史猜下一次访问,而推理流在访问之前几秒就把它宣告了出来,只是没有任何一层把这个宣告交给内存管理器。
一个直觉:宣告得早,就藏得住
这个直觉可以写成一个关于系统的主张:重新激活的起点可以从访问发生之时挪到访问被宣告之时。工具调用的名字出现在 token 流里的那一刻,就开始恢复这个沙箱的内存;等参数流完、调用真正派发时,页已经回到内存里,沙箱唤醒不再上关键路径。于是回收方可以在每一个闲置间隙都把沙箱压到接近零,而不必担心唤醒延迟。
它看起来成立,是因为三组量级看起来对得上。提前量在秒级,因为参数要一个 token 一个 token 地流出来。重新激活也在秒级,因为 GB 级工作集从盘上或压缩内存里取回,每秒几 GB 的量级。而调用到达时才开始的 REAP 式预取依赖工作集稳定,agent 的每次工具调用命令与文件都不同,工作集是否稳定正是未知数。但只有一个更早的触发点还不够,那只是一个调度策略;这个主张要成立,必须同时满足两件事:重新激活是秒级且调用时预取吸收不了,以及提前量足够长且工作集能由调用内容预测。
四条证伪线与测量设置
四条证伪线在任何测量之前就已固定:调用到达时预取的额外延迟中位低于 0.3 秒,说明最强现成组合已经够用;把到达时预取的额外延迟全部藏掉,在最有利沙箱上也省不到每步会话时间的 10%;提前量中位低于 0.5 秒;相邻两次调用触及集的重合度高于 0.8,说明工作集稳定、REAP 已覆盖。任何一条成立,这个主张就不成立。
提前量有两个来源。一是 204 个来自 Claude Code 的真实 coding agent 会话日志(含子 agent),共 13409 个工具调用块。日志在每个内容块结束时写一行,所以块开始的时刻用同一请求里上一条内容行的时间戳近似,块结束就是派发时刻;提前量等于两者之差,这是块级近似而不是 token 级时间戳,第一个块因为没有前驱被排除,剩 9599 个。二是在两张 A40 上用 vLLM 0.25.1 以张量并行度 2 服务 Qwen3.6-35B-A3B,在 1、16、64 路并发下直接测流式接口里工具名可见到调用完成的时间。
重新激活在一台 KVM 客户机里测:Linux 6.8 内核,16 个 vCPU,24 GiB 内存。swap 分两档,一档是 20 GB 的 lz4 zram,另一档是宿主 SATA SSD 上的 16 GB virtio 盘(这块盘写满后 4K 随机读队列深度 1 约 23 MB/s,队列深度 32 约 354 MB/s,顺序 536 MB/s)。三类沙箱刻意选材质不同的:pandas 数据科学沙箱常驻 6.3 GB,几乎全是匿名页,数据是随机浮点数据框;Chromium 浏览器自动化沙箱 2.2 GB,84% 匿名,分布在九个进程里;Vite 加 TypeScript 的前端构建沙箱只有 0.16 GB,主要是文件页。每个沙箱跑一段约十次调用的真实工具序列。每次调用前用 memory.reclaim 把沙箱压到 8 MiB 以下,用 pagemap 与 mincore 记下这次调用真正触及的页,预取由沙箱控制组内的一个辅助进程用 process_madvise 加 MADV_WILLNEED 与 posix_fadvise 发起(process_madvise 手册)。
恢复方式按信号与内容两个维度排开:按需缺页;按上一次调用的记录在到达时预取(REAP 式);同一记录提前 1.7 秒发起;精确触及集在到达时发起;精确触及集提前 1.7 秒发起;以及在请求发出时就全量预取整个沙箱,提前 6.8 秒。精确触及集是事后才知道的,所以它是内容已知这一维的上界。每一种方式的额外延迟都相对常驻不回收的同一调用计算。每种方式每个沙箱只跑一遍调用序列,常驻基准在两遍之间最多差两倍,所以 0.5 秒以下的差别在噪声内,不能排序。作为对照,还用 CRIU 做了进程级 checkpoint 的全量恢复与 lazy-pages 恢复,后者由守护进程通过 userfaultfd 按缺页供页(CRIU lazy migration)。
证据:提前量有,但它不是主导量
图 1 是全文的读图路径。上面一条是一轮 agent 步骤,从长间隙之后请求发出,到模型写推理文本,到工具名与参数流出,到调用派发与执行。三条箭头是恢复可以开始的三个时刻:请求发出时(agent 的执行框架本来就知道),工具名可见时(前面那个主张),以及调用派发时(按需缺页与 REAP)。下面的方框是后文所有数字都要服从的条件:触及字节不超过提前量乘以有效恢复带宽,恢复才能被完全藏住。框里的两个有效带宽是从实测读出来的,pandas 的数组在 swap 上连续,546 MB 在 1.42 秒里取回,约 0.38 GB/s;Chromium 的堆页分散,148 MB 要 6.21 秒,约 24 MB/s,接近 SATA 盘 4K 随机读队列深度 1 的速度。同样 1.7 秒的提前量,前者能藏约 0.65 GB,后者只能藏约 40 MB。
图 2 的横轴是调用可以被派发之前的提前量,对数刻度,纵轴是累积比例。实线是真实会话里从工具名出现到派发,中位 1.71 秒,p90 13.2 秒,只有 4.2% 低于 0.5 秒的证伪线,所以这条证伪线没有触发。它的长短由参数长度决定,折算约每秒 170 字节,也就是说 token 级提前量本质上是参数的流出时间。虚线是从请求发出到派发,中位 6.84 秒,是 token 级提前量的四倍;而紧跟工具结果发出的请求有 93.0% 最终以工具调用结束,这意味着在请求发出那一刻,执行框架就已经以九成以上的把握知道沙箱马上要被用到。本地模型的三条线说明提前量随负载变化:单路 0.50 秒,16 路 1.09 秒,64 路 2.82 秒,推理越忙提前量越长。
图 3 是本文的决定性数据。横轴是六个沙箱与层级的组合,每组六根柱是六种恢复方式,纵轴是相对常驻的额外延迟,对数刻度。先看最有利的那一组,也就是 SATA 盘上的 pandas 沙箱。按需缺页中位多 4.04 秒;按上一次调用记录的集合预取反而更差,到达时发起 6.11 秒,提前 1.7 秒发起也只降到 4.73 秒;精确触及集在到达时发起就降到 1.42 秒,再加 1.7 秒提前量到 0.35 秒。换一种说法:从历史换成精确内容,省下约 4.7 秒;在精确内容上再加提前量,只多省约 1 秒。这是标题的来由。到达时预取 6.11 秒不低于 0.3 秒,按每步平均会话时间 25.6 秒算,藏掉它相当于 23.8%,高于 10%,所以四条证伪线里的前两条也都没有触发。
记录预取为什么反而比按需缺页差,原因在相邻两次调用的触及集几乎不重合:pandas 的中位重合度是 0.054,Chromium 是 0.22 到 0.26,只有 Vite 构建沙箱达到 0.75。REAP 在 serverless 函数上测到的是 76% 到 97%。agent 在数据沙箱里每次调用读的是不同的列、不同的切片,上一次的记录大部分是白读,而且白读占用了盘的带宽。第四条证伪线(重合度高于 0.8)因此也没有触发,而且是往反方向远离。
右面板的均值讲的是另一件事。pandas 盘上各方式的均值都在 8 到 30 秒,远高于中位,是被少数几次调用拉上去的:布尔过滤、排序、query 与抽样这类操作会物化整张表,真实触及 5.1 GB,在 SATA 盘上无论用哪种方式都要 17 到 98 秒。Chromium 盘上出现了一个反直觉的点:精确预取这次触及的 148 MB 到达时要 6.2 秒,提前 1.7 秒也还要 5.4 秒,而在请求发出时就把 1.8 GB 全部按顺序读回来,只多 0.45 秒。多读十倍的字节反而快十几倍,说明恢复代价不按字节付,而按换出页在 swap 上的分散程度付。zram 上所有方式都在约 1 秒以内,但随机浮点数据只压到 1.23 倍,只省下约 19% 的内存;Chromium 的 JS 堆压到 3 到 13 倍,这是在合成页面上测的,偏乐观。
几组对照补齐了图外的空间。CRIU 全量恢复 6.4 GB 镜像中位 15.8 秒;lazy-pages 恢复本身只要 0.55 秒,但之后的调用变慢,8 个调用平均多 9.6 秒,整表抽样那一次在 lazy-pages 下超过 12 分钟没有完成,守护进程单核满载。一次回收加全量换入会让透明大页从 5990 MB 掉到 22 MB,但调用并不变慢。process_madvise 的 MADV_WILLNEED 只把页读进 swap cache,不建立页表,全量预取之后仍有约 1.1 GB 要走次缺页,形成 0.3 到 0.6 秒的底。
最后是内容能否在调用到达前被预测。我们写了一条只看调用文本的规则:从调用里出现的列名推出要读哪些列,再映射到这些列的地址区间。规则与 6 个留出调用在任何留出调用运行之前冻结。在 14 个不物化整表、触及集非空的调用上,召回 0.92 到 0.995,精度 1.0,按预测提前 1.7 秒恢复的额外延迟中位在原调用上 0.77 秒、留出调用上 0.73 秒,对照按需缺页 4.2 到 4.3 秒。但 3 个整表调用的召回只有 0.09 到 0.19,均值因此回到 25.6 秒,与按需缺页的 29.2 秒几乎持平。如果按参数真实的流出时序逐列发起,中位是 1.1 到 1.4 秒,时机的一半被参数流出吃掉了:列名本身就在参数里,它出现得越晚,留给恢复的时间越少。
图 4 把实测的恢复代价代回真实会话的闲置几何,这是一个桌面计算,回收本身的耗时按 2 秒计,对回路内回收偏乐观。横轴是增加的延迟占 agent 活跃时间的比例,对数刻度,纵轴是释放的沙箱闲置内存秒数比例。圆点是只在超过 600 秒的人等间隙回收、在请求发出时全量恢复:释放 90.4%,重新激活 426 次,延迟在最差的 pandas 盘上是活跃时间的 1.7%,在其余沙箱上不到 0.2%。方块是前面那个主张对应的策略,每个间隙都回收、用 1.7 秒 token 级提前量恢复:释放 96.7%,重新激活 7442 次,延迟在 pandas 盘上用精确集合是 20.0%、用历史记录是 64.6%。三角是每个间隙回收、到达时恢复:98.5%,延迟最高到 111.7%。90.4% 这个数就是闲置几何本身:204 个会话里,回路内的短间隙只占闲置内存秒数的 9.6%,所以任何只在工具回路内起作用的回收方案,内存收益上界就是这 9.6 个百分点。
时机输给了内容,也输给了更早的信号
四条事先写死的证伪线,一条都没有触发。这个主张不是被其中一条拦下来的。它在数据面前换了一种说法,换过之后仍然不成立。原因有三层。
时机不是主导量。同一个沙箱、同一块盘,从历史记录换成精确内容,大约省 4.7 秒。在精确内容上再提前 1.7 秒,只再省大约 1 秒。没有精确内容时,提前量几乎没用。原先以为值钱的是何时开始取。数据说明值钱的是取哪些页。
token 级信号上面,还有一个系统早就有的信号。请求一发出,执行框架就知道沙箱马上要用。这个信号中位提前 6.84 秒,是 token 级的四倍,而且 93% 的请求确实以工具调用结束。交互式会话里,用这个请求级信号,并且只在人等的间隙回收,已经拿到 90.4% 的内存收益。token 级方案只多拿 6.3 个百分点,延迟却要高一到两个数量级。
把主张改成按调用参数预测触及集,仍然不够。没有人等间隙的自主回路里,例如 RL rollout,请求级信号的优势没有了,回路内回收成了唯一的收益来源。按闲置几何算,回路内回收的理想密度上限大约 1.76 倍。这是这个方向还在的空间,按参数恢复是想把这块空间兑现的那条路。它只在不物化整张表的调用上成立。整表调用恰恰是把均值拉高的那一类,在 SATA 盘上任何提前量都藏不住。zram 上延迟只多 1.8% 到 3.8%,但数值数据只省 19% 内存,密度大约 1.09 倍。把参数接到恢复上,只需要一个预测器。机制本身可以由流式接口、Orion 那种到达前预热、REAP 那种预取,再加上 Linux 的回收接口拼出来。去掉包装,剩下的是几条新测量,不是新机制。同一方向上,还有只发在 arXiv 的工作,用关键词和流式嵌入在 token 流里提前预热沙箱(SpecBox, arXiv 2607.23933)。这个触发点本身并不少见。
还有几处没测到。测试机只有 SATA 盘。NVMe 大约快一个数量级,CXL 内存池更快,能藏住的边界会从 0.65 GB 移到数 GB,整表调用也许能被藏住。这个方向对原先的主张有利,但没测。三个沙箱都是构造的。6 GB 的 pandas 沙箱是故意挑的有利配置,真实部署有多大并不知道。沙箱数字都来自 KVM 客户机,缺页里含 EPT 开销,恢复会显得比裸机更贵。每种方式只跑了一遍调用序列,0.5 秒以下的差别不能排序。会话里的提前量是内容块的时间戳,不是 token 的。Chromium 的压缩比来自合成页面。带 GPU 的沙箱没有测。
关于 agent 沙箱内存的五条判断
真实 coding agent 会话里,工具名一出现,到调用可以派发,中位提前 1.71 秒。长短由参数决定,大约每秒 170 字节。从请求发出到派发则是 6.84 秒,而且 93% 的请求以工具调用结束。新的提前信号要拿来和系统已经有的最早信号比,而不是和没有信号比。多出来的只有精度和内容。这是在 204 个 Claude Code 会话上、按内容块近似测的。推理越忙,token 级提前量越长。本地 35B MoE 从单路 0.50 秒升到 64 路 2.82 秒。
agent 数据沙箱的工作集不会在下一次调用里重现。相邻两次调用的触及集,pandas 上中位只重合 0.054,Chromium 上是 0.22 到 0.26,只有前端构建沙箱到 0.75。serverless 函数是 76% 到 97%。所以把上一次的记录拿来预取,在数据沙箱上可能比按需缺页更差。SATA 上的 pandas 沙箱,记录预取的中位额外延迟是 6.1 秒,按需缺页是 4.0 秒。这是三个构造出来的沙箱、每个大约十次调用。文件页为主的前端构建是例外。
重新激活能被藏住,条件是触及的字节不超过提前量乘以有效恢复带宽。这个带宽由存储层级决定,也由换出的页在 swap 上怎么排决定,不是设备标称带宽。SATA SSD 上,连续排着的数组大约 0.38 GB/s。散在九个进程里的浏览器堆只有大约 24 MB/s。同样 1.7 秒,前者能藏的字节是后者的 16 倍。Chromium 沙箱精确预取 148 MB 要 6.2 秒,把 1.8 GB 按顺序全读回来只多 0.45 秒。代价模型里只写字节除以带宽,在这里会低估 3 到 16 倍。
交互式 agent 会话里,沙箱闲置内存秒数的 90.4% 落在超过 600 秒的人等间隙里。回路里的短间隙只占 9.6%。所以只在长间隙回收,并在请求发出时把沙箱全部恢复,就拿到九成收益。最差的沙箱上,延迟也不到活跃时间的 1.7%。只在工具回路里回收的方案,内存收益到 9.6 个百分点就到头了。这依赖这批会话里人回来的节奏,也依赖把回收耗时按 2 秒计。没有人参与的自主回路里,这条不成立。那里只有回路内回收能拿到收益。
数据沙箱里,一次调用会碰到哪些页,按列来看几乎可以从调用文本推出来。召回在 0.92 以上,精度是 1.0。这只对不把整张表物化的调用成立。布尔过滤、排序、query 和抽样会碰到整张表,召回掉到 0.2 以下。在 SATA 盘上,这些调用无论怎么恢复都要 17 到 98 秒。能预测的那些调用,本来就不贵。贵的那些,恰恰预测不了。这是在 6 GB 的随机浮点数据框上、用事先冻结的留出调用测的。更快的存储会把整表调用的代价缩小。
本文的覆盖范围到此为止:一台 KVM 客户机、SATA 与 zram 两种层级、三类构造的沙箱、一批 coding agent 会话。它不能说明 token 级提前量能把沙箱重新激活移出关键路径,也不能说明 agent 沙箱工作集普遍是 GB 级,更不能外推到 NVMe 与 CXL。它能说明的是:在这些条件下,决定沙箱唤醒代价的是要取回什么以及它们怎么排,而不是什么时候开始取。
九成闲置内存就是人等的那一段
交互式会话里,90.4% 的沙箱闲置内存秒数落在超过 600 秒的人等间隙里。只在那里回收,并在请求发出时把沙箱全部恢复,就拿到九成内存收益,延迟不到活跃时间的 1.7%。新的提前信号要拿来和系统已经有的最早信号比。恢复能不能被藏住,取决于碰到多少字节、提前多久,以及有效恢复带宽。带宽由换出之后页怎么排决定。
相关分析
Agent 沙箱还能如何减少运行时内存开销和page fault 从另一头看同一次唤醒。回收之后页落在 swap 的哪里,以及在 Linux 6.1 和 6.12 上,放置还能省掉多少读盘。